For those masochistic, numbers-obsessed types who want to see more numbers behind the Summer Solar Summary post, here you go.
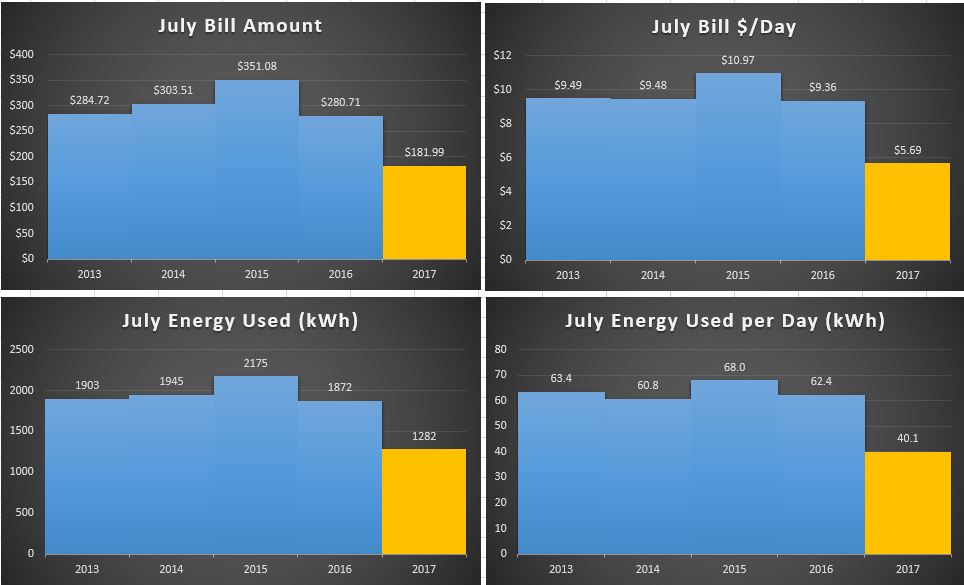
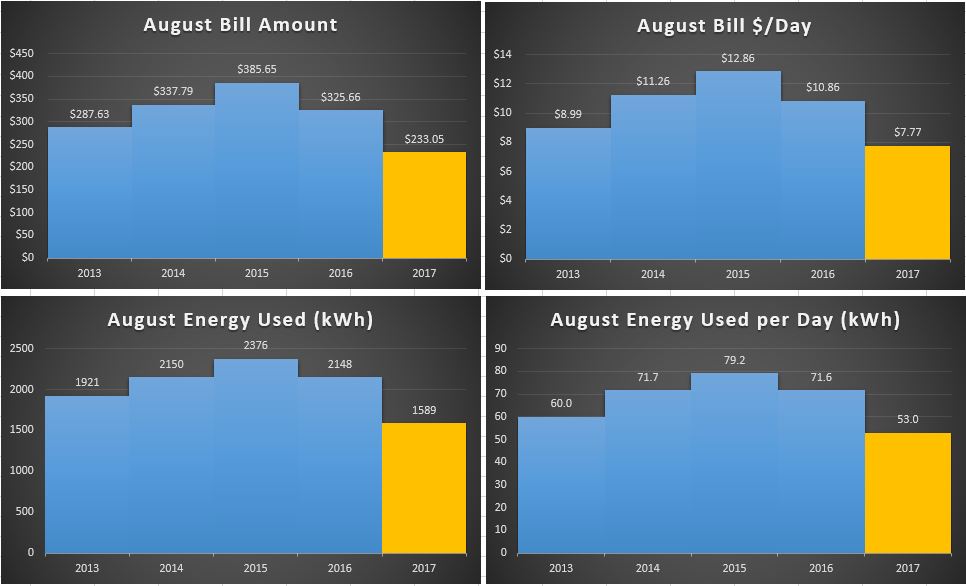
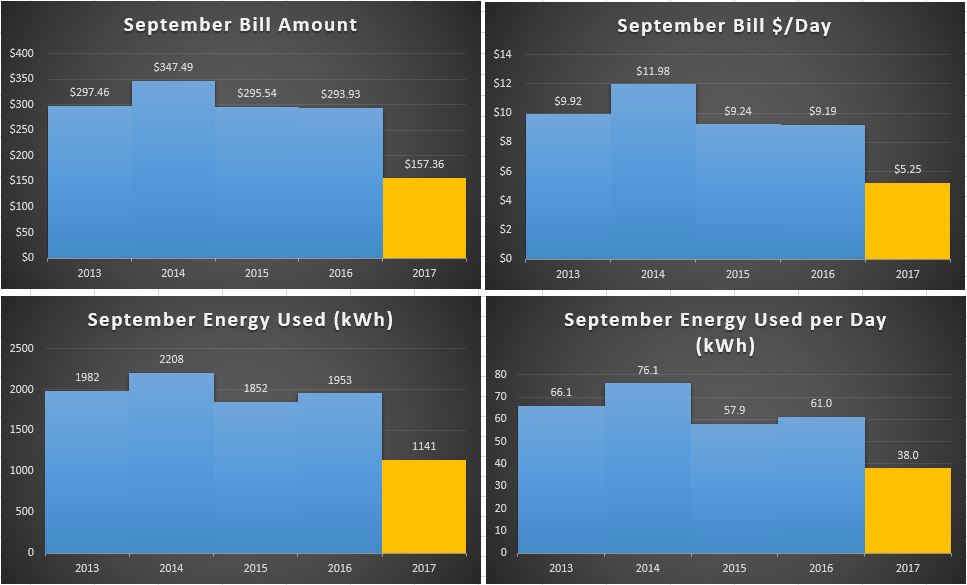
Below are the detailed graphs of the bills for July, August, and September for the last five years. Electric bills can cover a different number of days (29, 30, 31, 32) depending on when the bills were calculated. Therefore, each set of graphs also includes a per-day number set as well so that you can see normalized information.
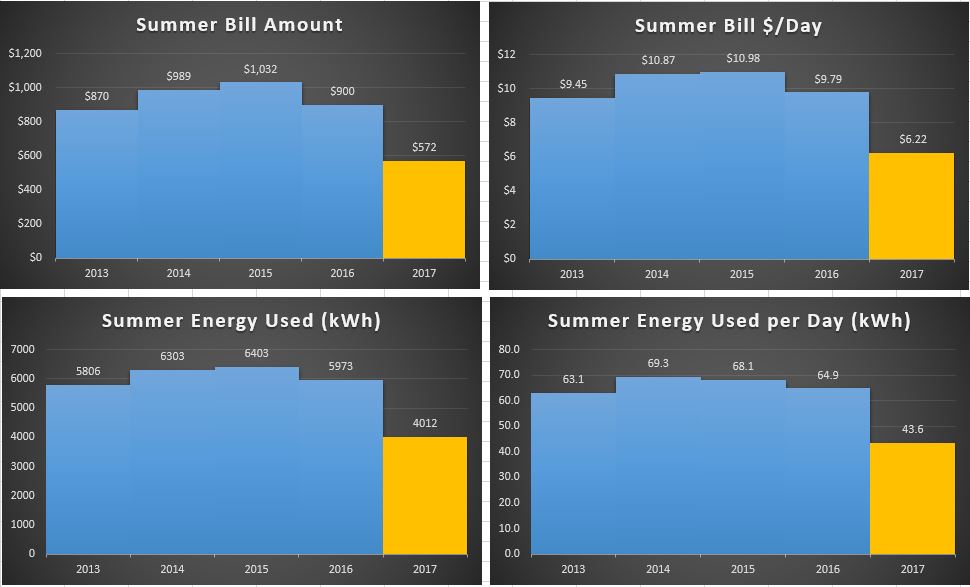
In every case there is a significant drop this year from previous years. The summary graphs on the blog post that combine all of these generally average out the effects of different numbers of days, so should be a valid representation of the savings achieved. However, if anyone wants to see those as a per-day graph, they are included below as well.
Click on the graphs to see a larger, hopefully clearer view.